:format(webp)/cdn.vox-cdn.com/uploads/chorus_image/image/45504884/usa-today-8307003.0.jpg)
The 2014 Charting Project is the brainchild of Bill Connelly; check out his college football analytics blog, Football Study Hall.
But first, let’s talk about the Ewing Theory
If you don’t read about the NBA[1], you may not have ever heard of the Ewing Theory. Named after giant human sweat gland former Georgetown and Knicks center Patrick Ewing, the gist of the Ewing Theory is that, in certain cases, a team plays better when its star player is injured or otherwise uninvolved in the game. This was created by a compadre of Bill Simmons’ back in the 90s, as he noticed both Georgetown and the Knicks seemed to play better when Ewing wasn’t playing; it’s since been noted with other players and other teams. This can be extended to multiple seasons in professional sports, and there are some other qualifications that typically apply, but I’m throwing all of those out the window for the sake of conversation.
1 | More specifically, if you don’t read Bill Simmons, which you should because he’s great.
In this case, I’m of course talking about Ohio State’s carousel of unstoppable dual-threat quarterbacks. Preseason Heisman candidate Braxton Miller never saw the field in 2014 after wrecking his shoulder in fall camp, giving way to redshirt freshman J.T. Barrett. Barrett did proceed to blow most of Miller’s numbers out of the water in just 12 games, but the Ohio State offense as a whole didn’t see much of a change with him at the helm[2]. Legendary redshirt sophomore Cardale Jones took the reins for the last three games of the Buckeyes season, and merely captained them to a national title for his troubles.
2 | OF/+ | OS&P | OFEI ratings of 21% | 140.7 | 0.648 in 2014 vs. 22.1% | 140.8 | 0.624 in 2013. Yeah.
The question is – was this offense better with Jones running the show? To find out, I pulled all of Ohio State’s offensive plays from the 2014 season that were available to me and crunched the numbers, and this is what I found:
| The Impact of J.T. Barrett’s Injury | ||
|---|---|---|
| METRIC | WITH BARRETT | WITHOUT BARRETT |
| Pass % | 41.2% | 37.8% |
| Yards Per Att. | 8.8 | 10 |
| Success Rate | 52.3% | 49.3% |
| Rush % | 58.8% | 62.2% |
| Yards Per Carry | 5.9 | 6.2 |
| Success Rate | 51.3% | 48.7% |
There are a couple of caveats I need to mention before we discuss the results. Unfortunately, this does not reflect Ohio State’s first two games against Navy and One True National Champion Virginia Tech[3], as the play-by-play portion of those charting templates were incomplete, and I determined it wasn’t worth it to fill them in — 10 games is a fine sample of the offense with Barrett in charge. This only reflects non-garbage plays, and has end-of-half kneeldowns removed. I don’t have the information handy to determine if there are any spikes in here, but I did a quick look at incomplete passes in the 2nd and 4th quarter and only saw one or two plays that might have been spikes — not enough to worry about it. Lastly, keep in mind the three opponents Jones faced (Wisconsin, Alabama, and Oregon) were all top-20 defenses by DF/+, whereas Barrett got a cornucopia of suck plus Virginia Tech and Penn State.
3 | Well, by the transitive property, anyway.
So what can we take away from this? Ohio State shifted a bit toward running the ball with Jones, and it paid dividends. Jones[4] averaged over a yard more per passing attempt than Barrett, and the offense averaged 0.3 yards more per carry. Success rates were down but only slightly, and probably speak more to the quality of the defenses than the efficacy of the offense. The Buckeyes offense was also hot garbage against Virginia Tech, and if those results had been reflected here it would probably drop the pre-Cardale numbers a bit.
4 | Plus that ridiculous WR-to-WR touchdown pass we’ll talk about later.
The jump in YPA to me is mostly Jones’ ridiculous arm, as Barrett had a slightly higher completion percentage on the year than Jones did in his three games. I can’t tell you from this if Jones should be the QB next season, but which one of the three[5] gets the job is probably your story of the offseason. What I can say is it appears as though whoever’s taking snaps in this offense is irrelevant, as there was very little dropoff between Miller, Barrett, and Jones. Almost like it’s the system or something.
5 | Assuming all three stick around; Miller’s the only likely transfer candidate to me.
The jump in yards per carry, however, is much more interesting. Ezekiel Elliott received quite a few additional carries in Barrett’s absence, and went for 200+ in each game as a result. A good chunk of that production came on two 80+ yard runs against Wisconsin and Alabama, but the guy still averaged over 7 yards a carry outside of those two runs. In this sense, Barrett’s injury appears to have revealed a way for the Buckeyes to get even more explosive, which is troublesome news for their opponents next season.
Closing The Book On 2014
I didn’t get around to doing a separate Charting the Tide for just the Sugar Bowl, mainly because I elected not to think about football for about two weeks after the game — I’m sure you understand why. As such, I’m folding those results in with the 2014 review, which will be done along the same lines as what I did during the last bye week. As before we’ve got 223 plays in "Season A", consisting of West Virginia through Florida, and 276 plays from "Season B", consisting of Ole Miss through the Creamsicles. "Season C" is the last 6 games of the year, and consists of 430 plays. A bit lopsided, but tables can only be so wide — feel free to blame Mississippi State and Alabama Poly and their HUNH nonsense. At any rate, for each category you’ll see the Ohio State results stacked up against 2014 as a whole, and a second table with the 2013 numbers against the three 2014 season splits. This will be quite lengthy, but informative. Onward!
The Goods
- Air Yards — The down-the-field or vertical yardage gained on a pass play as a result of the quarterback’s throw (i.e., prior to the receiver’s involvement), as measured from the line of scrimmage. So for forward passes thrown behind the line of scrimmage, the Air Yardage would be negative. This metric is also tracked on incomplete passes — underthrown balls are measured from where the ball lands, and overthrown balls from where the intended receiver is. Balls tipped at the line or thrown away are not measured. The companion statistic on completed passes is yards after catch — the sum of Air Yards and yards after catch on a completed pass equals the yardage gained on the play.
- Blake Sims Map of Quarterbacking Excellence — Hand-crafted using the absolute finest graphical techniques of the late 90s, the Blake Sims Map of Quarterbacking Excellence breaks the field down into 9 blocks by Air Yards (Behind L.O.S, 0 - 10 Yards, Over 10 Yards) and area of the field relative to the hash the ball was placed on (Left, Middle, Right). Each block contains the frequency (number of passes to that block of the field over the number of passes at that distance from the line of scrimmage), completion percentage, and success rate. The block behind the line of scrimmage in the middle of the field contains the man himself, Blake Sims. The hashmarks are even relatively accurate!
- Catch Rate — The number of balls caught over the number of targets for an individual, or how often a receiver makes the catch when targeted.
- Disruptive Plays — A sum of sacks, blocked kicks/punts, passes defensed, interceptions, and forced fumbles. Think of these as things that got you multiple helmet stickers when you were playing peewee.
- Distance Splits — The "distance" on these charts refers to the yardage required to gain a first down, not the yardage required for a successful play (see Success Rate).
- Frequencies for Rushing and Passing Splits by Down — These numbers refer to the percentage of first down plays that were a rush, second down plays that were a pass, and so on, NOT the percentage of rushes that were on first down. For example, the sum of first down pass frequency and first down rush frequency will be 100%, but the sum of first, second, third, and fourth down rush frequencies will be well in excess of 100%.
- Garbage Time — Defined as when a game is not within 28 points in the first quarter, 24 points in the second quarter, 21 points in the third quarter, or 16 points in the fourth.
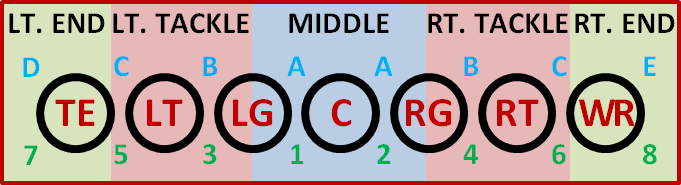
- Run Directions — See the figure below. Defensive letter gap terminology is on the top in blue, and offensive hole terminology is on the bottom in green. Rushes are coded as "Left Tackle" if they head through the left B and C gaps / the 3 and 5 holes, and so on.
- Success Rate — A "successful" play is defined as gaining 70% of required yardage on first down, 50% of required yardage on second down, and all of the required yardage on third and fourth downs — required yardage is another term for the distance required for a first down on a given play. Success rate is simply how often a team is successful.
- Target — The intended receiver on a pass play. All pass plays have intended receivers, with the exception of passes that were tipped at the line, thrown away, or otherwise thrown in such a manner as to render identification of an intended receiver impossible.
| Formation/Play Action Splits — Sugar Bowl | |||||
|---|---|---|---|---|---|
| Plays | Frequency | Success Rate | |||
| Formation | VS. OHIO STATE |
VS. OHIO STATE |
2014 Season |
VS. OHIO STATE |
2014 Season |
| Shotgun | 73 | 93.6% | 81.4% | 42.5% | 35.8% |
| Pistol | 5 | 6.4% | 3.7% | 20% | 14.3% |
| Under Center | 0 | 0% | 14.9% | N/A | 31.6% |
| No Huddle | 52 | 66.7% | 57.7% | 42.3% | 36.3% |
| Huddled | 26 | 33.3% | 42.3% | 38.5% | 31.9% |
| Play Action | 7 | 8.9% | 7.7% | 28.6% | 42.3% |
| Formation/Play Action Splits — 2014 Season | |||||||||
|---|---|---|---|---|---|---|---|---|---|
| Frequency | Success Rate | ||||||||
| Formation | 2013 Season |
2014 Season A |
2014 Season B |
2014 Season C |
2013 Season |
2014 Season A |
2014 Season B |
2014 Season C |
|
| Shotgun | 49.3% | 92% | 68.9% | 83.5% | 42.5% | 33.3% | 37.7% | 36% | |
| Pistol | 45.6% | 7.3% | 3.3% | 2.5% | 42.8% | 18.2% | 14.3% | 10% | |
| Under Center | 5.2% | 0.67% | 27.8% | 14% | 21.4% | 100% | 27.1% | 33.3% | |
| No Huddle | 58.1% | 74.7% | 46.8% | 56.8% | 43% | 29.5% | 41.6% | 37.2% | |
| Huddled | 41.9% | 25.3% | 53.2% | 43.2% | 39.5% | 42.1% | 27% | 32.4% | |
| Play Action | 11.4% | 4.9% | 9.4% | 7.9% | 41.2% | 45.5% | 50% | 35.3% | |
Observations
Like most of these new-fangled no-huddle spread-option offenses, Ohio State operated almost exclusively out of the shotgun, with a handful of pistol looks thrown in for chuckles. They were also quite a bit more successful than the Tide normally allowed, turning in a success rate roughly 7% higher than usual regardless of formation. Play action passes didn’t go so well for them, with the notable exception of Evan Spencer’s ridiculous TD pass in the first half, a play where everything went just right for the Buckeyes.
It’s fun to slice up the season into rough thirds like this, as it really tells the story of the type of offenses the Tide faced during those segments. The first and third segments reveal a huge slant toward HUNH offenses, reflecting teams like West Virginia, Mississippi State, Alabama Poly, and Ohio State. The middle third was more conventional with a higher percentage of under center and play-action looks, mainly due to the Arkansas game. If Texas A&M had shown up for their game against the Tide the breakdown would be a little more even, but… well, they didn’t show up, and most of the plays from that game went into the garbage pile. Success rates remained fairly consistent throughout the season when accounting for frequencies, with the notable exception of an uptick in efficiency on no-huddle plays in Season B (Ole Miss) as well as a downtick on huddled plays (Arkansas).
The most notable result for 2013 vs. 2014 is the dramatic shift in the frequency of pistol formations, which dropped by almost 40%. The 2013 sample is incomplete with respect to the schedule, but this is probably a matter of who was doing the charting. I’m fairly stingy with what I consider a pistol formation, and whoever charted the 2013 games is clearly less picky about the distinction. Either that or everyone abandoned the pistol in the offseason. The 2014 Tide also put up significantly better success rates against all formations, but was about the same against play-action passes.
| Passing Splits — Sugar Bowl | |||||
|---|---|---|---|---|---|
| Attempts | Frequency | Success Rate | |||
| Down | VS. OHIO STATE |
VS. OHIO STATE |
2014 Season |
VS. OHIO STATE |
2014 Season |
| 1st | 15 | 44.1% | 42.3% | 26.7% | 36.3% |
| 2nd | 12 | 46.2% | 50% | 33.3% | 41.1% |
| 3rd | 9 | 50% | 66.7% | 55.6% | 37.5% |
| Air Yards | VS. OHIO STATE |
VS. OHIO STATE |
2014 Season |
VS. OHIO STATE |
2014 Season |
| Under 5 | 7 | 22.6% | 38.3% | 14.3% | 35% |
| 5 - 10 | 11 | 35.5% | 23.5% | 45.5% | 46.5% |
| 11 - 15 | 4 | 12.9% | 10.9% | 75% | 60% |
| Over 15 | 9 | 29% | 27.3% | 44.4% | 37% |
| Passing Splits — 2014 Season | |||||||||
|---|---|---|---|---|---|---|---|---|---|
| Frequency | Success Rate | ||||||||
| Down | 2013 Season |
2014 Season A |
2014 Season B |
2014 Season C |
2013 Season |
2014 Season A |
2014 Season B |
2014 Season C |
|
| 1st | 39.2% | 51.6% | 36.7% | 41% | 38.3% | 45.5% | 42.4% | 29.4% | |
| 2nd | 48.4% | 54% | 52.8% | 46.4% | 47.7% | 37% | 42.1% | 42.2% | |
| 3rd | 65.5% | 74.3% | 66.7% | 63.4% | 34.2% | 23.1% | 47.1% | 38.3% | |
| Air Yards | 2013 Season |
2014 Season A |
2014 Season B |
2014 Season C |
2013 Season |
2014 Season A |
2014 Season B |
2014 Season C |
|
| Under 5 | 41.7% | 48.2% | 34% | 35.5% | 32% | 26.8% | 51.5% | 32.3% | |
| 5 - 10 | 25.8% | 17.7% | 21.7% | 27.3% | 41.9% | 53.3% | 42.9% | 46% | |
| 11 - 15 | 10.8% | 7.1% | 16.5% | 9.8% | 61.5% | 50% | 75% | 50% | |
| Over 15 | 21.7% | 27.1% | 27.8% | 27.3% | 57.7% | 39.1% | 29.6% | 40% | |
Observations
In what will be an unfortunate (and unsurprising) trend in this piece, that 3rd down success rate against OSU jumps off the page. The Tide actually did a fine job against the Buckeyes on first and second downs, but simply couldn’t get a stop on thirds, at least not before some inspired but ultimately fruitless play in the second half. The Tide forced four three-and-outs in the half but gave up one backbreaker of a TD run to Elliott that we’ll talk about in great detail a bit later.
Ohio State didn’t find much success in the shorter game, putting up a putrid 14% success rate for routes under 5 yards and an average rate on routes from 5-10 yards. They totally abused ‘Bama on anything over 10 yards though, including a revolting 75% rate on 11-15 yard routes. That range of the field’s been a bugaboo all season, as evidenced by the 60% success rate for the year. Two of those 15+ yard routes were the aforementioned TD pass by Spencer — on which Cyrus Jones had great coverage negated by a once-in-a-lifetime kind of throw — and the touchdown by Devin Smith where Eddie Jackson fell down[6]. Even so, the longer routes were a problem for the Tide all year, and it finally caught up with them in this one.
6 | Jackson looked thoroughly toasted on that one to me, but it’s hard to say for sure.
Not too much to take away from the down splits, as the frequencies were pretty much in line all year and against 2013. The latter half of the year saw the Tide get real stingy on first down, posting a sub-30% success rate against some of the better passing offenses on the schedule. They also recovered a bit on third downs relative to the middle of the season, where Ole Miss in particular really tuned up the Tide on that down. Alabama was a smidge better on second downs relative to 2013, but that’s about it.
The distance splits are informative, particularly with respect to 2013 vs. 2014. For all the heartache about getting burned on deep routes this year, the secondary was markedly improved on the long balls relative to 2013, despite the departure of Ha-Ha Clinton-Dix. The 11-15 yard range was still a hot mess though, and strangely enough this year’s edition was a bit more susceptible on the shorter stuff. I suspect that’s due primarily to the departures of Vinnie Sunseri and Clinton-Dix, and the resultant effect on Landon Collins’ responsibilities.
| Rushing Splits — Sugar Bowl | |||||
|---|---|---|---|---|---|
| Attempts | Frequency | Success Rate | |||
| Down | VS. OHIO STATE |
VS. OHIO STATE |
2014 Season |
VS. OHIO STATE |
2014 Season |
| 1st | 19 | 55.9% | 57.7% | 36.8% | 16.3% |
| 2nd | 14 | 53.9% | 50% | 50% | 43.4% |
| 3rd | 9 | 50% | 32.8% | 55.6% | 42.4% |
| Direction | VS. OHIO STATE |
VS. OHIO STATE |
2014 Season |
VS. OHIO STATE |
2014 Season |
| Left End | 6 | 24% | 13.7% | 33.3% | 26.5% |
| Lt. Tackle | 0 | 0% | 14.5% | N/A | 22.2% |
| Middle | 11 | 44% | 42.3% | 45.5% | 27.6% |
| Rt. Tackle | 5 | 20% | 14.9% | 60% | 32.4% |
| Right End | 3 | 12% | 14.5% | 66.7% | 36.1% |
| Rushing Splits — 2014 Season | |||||||||
|---|---|---|---|---|---|---|---|---|---|
| Frequency | Success Rate | ||||||||
| Down | 2013 Season |
2014 Season A |
2014 Season B |
2014 Season C |
2013 Season |
2014 Season A |
2014 Season B |
2014 Season C |
|
| 1st | 60.8% | 46.9% | 63.3% | 59% | 34.3% | 16.7% | 8.8% | 20.4% | |
| 2nd | 51.7% | 46% | 47.2% | 53.6% | 51.1% | 47.8% | 44.1% | 40.5% | |
| 3rd | 34.5% | 25.7% | 31.4% | 36.2% | 55% | 22.2% | 43.8% | 47.1% | |
| Direction | 2013 Season |
2014 Season A |
2014 Season B |
2014 Season C |
2013 Season |
2014 Season A |
2014 Season B |
2014 Season C |
|
| Left End | 10.2% | 7% | 16.9% | 14.3% | 18.2% | 66.7% | 27.3% | 20% | |
| Lt. Tackle | 17.6% | 9.3% | 15.4% | 15.7% | 36.8% | 0% | 20% | 27.3% | |
| Middle | 46.3% | 53.49% | 40% | 40% | 42% | 26.1% | 26.9% | 28.6% | |
| Rt. Tackle | 10.2% | 18.6% | 16.9% | 12.9% | 36.4% | 25% | 18.2% | 44.4% | |
| Right End | 15.7% | 11.6% | 10.8% | 17.1% | 41.2% | 40% | 28.6% | 37.5% | |
Observations
The results in the run game were the most surprising, and hence the most disappointing, aspect of the Sugar Bowl performance to me. The Buckeyes put up 281 yards at 6.7 yards per carry, easily the Tide’s worst effort of the year. To be fair, 186 of those yards came on just four runs: two 20+ yard scrambles by Jones, Elliott’s first half run of 54 yards that was mostly due to some really puzzling tackling efforts by the Tide secondary, and the aforementioned game-sealer in the 4th that merits a bit more attention.
Reggie Ragland was out of the game at that point with what appeared to be a concussion[7], and Collins had gone out on the previous play after re-injuring his shoulder trying to bring down Jones[8]. Laughably inexperienced true freshman Shaun Dion Hamilton was in for Ragland, and of course the secondary was lacking its best run stopper in Collins. The run around the left end was beautifully set up, most notably by an outstanding block from Spencer that took out both Hamilton and Trey DePriest, who were positioned to blow up the play. Elliott proceeded untouched for 85 yards, and Tide fans everywhere threw up a little. I'm not getting my Texas on here, but you have to wonder if that run happens with those two guys in the game.
7 | When Ragland was being checked out on the field, you could hear a YEAH YEAH YEAH YEAH coming in over the telecast. In the Superdome.
8 | Which was doable in the pocket — three sacks and four TFLs showed that — but monstrously difficult once the big man took off north-south.
Despite all the negative plays the Buckeyes pulled off a highly successful rushing effort that comfortably eclipsed all of the Tide’s success rates for the year, including another way-too-high success rate on third downs. Equally disconcerting was the 45.5% on runs up the middle, which does not include any of Jones’ work[9]. The Tide’s continued weakness around the right side (of the offense) presented itself yet again, with success rates in excess of 60%.
9 | QB runs have their own direction/type column, so while they show up in the down splits they do not in the directional splits.
Nothing too exciting from the frequency splits in 2014, though the success rate section is a different story. The Tide’s run defense got progressively worse on third downs over the course of the year, undoubtedly the result of facing better and better rushing teams down the stretch — this played a role in the increase of some of the directional success rates in Season C as well. Despite that, the 2014 Tide was undoubtedly a better rushing defense than the 2013 defense, with lower success rates allowed on all downs and in every direction but the left end. Speaking of which, I should note that miraculous improvement on left end runs from the early part of the season is a mirage, as Season A had only 3 left end carries in non-garbage time.
| Down and Distance Splits — Sugar Bowl | |||||
|---|---|---|---|---|---|
| Plays | Frequency | Success Rate | |||
| Down | VS. OHIO STATE |
VS. OHIO STATE |
2014 Season |
VS. OHIO STATE |
2014 Season |
| 1st | 34 | 43.6% | 41.4% | 32.4% | 24.8% |
| 2nd | 26 | 33.3% | 33.5% | 42.3% | 42.3% |
| 3rd | 18 | 23.1% | 23.4% | 55.6% | 38.9% |
| 4th | 0 | 0% | 1.7% | N/A | 53.9% |
| Distance | VS. OHIO STATE |
VS. OHIO STATE |
2014 Season |
VS. OHIO STATE |
2014 Season |
| Under 3 Yards | 10 | 12.8% | 10.5% | 60% | 55.6% |
| 4 to 6 Yards | 13 | 16.7% | 14.3% | 38.5% | 43.6% |
| 7 to 10 Yards | 48 | 61.5% | 66.1% | 41.7% | 30.5% |
| Over 10 Yards | 7 | 8.97% | 9.1% | 14.3% | 24.3% |
| Down and Distance Splits — 2014 Season | |||||||||
|---|---|---|---|---|---|---|---|---|---|
| Frequency | Success Rate | ||||||||
| Down | 2013 Season |
2014 Season A |
2014 Season B |
2014 Season C |
2013 Season |
2014 Season A |
2014 Season B |
2014 Season C |
|
| 1st | 44.1% | 42.7% | 41.7% | 40.8% | 35.8% | 31.3% | 21.1% | 24.1% | |
| 2nd | 33.5% | 33.3% | 33.3% | 33.9% | 49.5% | 42% | 43.1% | 41.3% | |
| 3rd | 21.3% | 23.3% | 23.6% | 23.1% | 41.4% | 22.9% | 45.1% | 41.5% | |
| 4th | 1.1% | 0.7% | 1.4% | 2.2% | 33% | 0% | 0% | 77.8% | |
| Distance | 2013 Season |
2014 Season A |
2014 Season B |
2014 Season C |
2013 Season |
2014 Season A |
2014 Season B |
2014 Season C |
|
| Under 3 Yards | 13.6% | 8.7% | 8.8% | 12% | 73% | 46.1% | 57.9% | 57.1% | |
| 4 to 6 Yards | 11.8% | 13.3% | 10.7% | 16.5% | 46.9% | 40% | 60.9% | 38.8% | |
| 7 to 10 Yards | 62.1% | 66% | 68.1% | 65.1% | 37.9% | 31.3% | 28.6% | 30.9% | |
| Over 10 Yards | 12.5% | 12% | 12.5% | 6.4% | 20.6% | 22.2% | 22.2% | 26.9% | |
Observations
Our dear friend 55.6% success rate on third downs is back, thanks to an oddly symmetric split of play types and success on third downs for the Buckeyes. That’s well in excess of the Tide’s already too-high season average, and that was the difference in the game on that side of the ball. Ohio State achieved a good bit of that success on third and longs (7 or more yards to go), posting a 60% success rate on those plays, including both of Smith’s 40+ yard receptions.
Only notable result I saw from the frequency splits is the Tide forced their opponent into downs with over 10 yards to gain about half as often in the latter part of the season, which again is probably a function of the quality of offenses faced. The latter part of the season also saw a lot of success for opponents on fourth downs, although a good chunk of that came on end-of-half desperation drives by Mississippi State. Once again the 2014 Tide finished with lower success rates overall, with the exception of a slight uptick on those 10+ yard downs.
| Disruptive Plays — 2014 Season | ||||||
|---|---|---|---|---|---|---|
| Player | Passes Defensed | Interceptions | Sacks | Forced Fumbles | Blocked Kicks | Total |
| Cyrus Jones | 9.5 | 3 | 2 | 14.5 | ||
| Eddie Jackson | 7 | 1 | 1 | 3 | 12 | |
| Xzavier Dickson | 1 | 9 | 10 | |||
| Landon Collins | 5 | 3 | 1 | 9 | ||
| A’Shawn Robinson | 3 | 2 | 1 | 1 | 7 | |
| Reggie Ragland | 2 | 1 | 2.5 | 1 | 6.5 | |
| Jonathan Allen | 1 | 4.5 | 1 | 6.5 | ||
| Nick Perry | 4.5 | 2 | 6.5 | |||
| Jarran Reed | 5 | 1 | 6 | |||
| D.J. Pettway | 2 | 3.5 | 6 | |||
Observations
Typically I only do the top-5 here, but I thought at the end of the season it might be nice to expand things a bit to the top-10 and give a bit of love to the big uglies. Cyrus Jones finishes as your disruptive plays leader, mainly on the strength of a team-leading 9.5 passes defensed. Jones got abused a bit in run-support, but snagged an interception against the Buckeyes and added two more defensed passes, including one that was almost a pick-six. It would not surprise me if Jones got some preseason all-SEC looks next year, as he’s come a long way this season.
Jackson had a nice pass break-up and forced a fumble that lead to the Tide’s first touchdown, but was burned a couple of times and badly stiff-armed on Elliott’s 54 yard run in the first half. Xzavier Dickson picked up his 9th sack of the season, and leaves giant shoes to fill with his departure from the Capstone. Collins is taking his talents to the NFL as well, with his last game in crimson plagued by injuries and missed tackles. He did recover the fumble forced by Jackson, though.
Big A’Shawn Robinson’s name wasn’t called quite as much this season, but he was a terror all year long. He even blocked an extra point against Ole Miss that would have been the difference in the game if not for Blake Sims’ slightly errant pass at the very end of that one. Sir Reginald the Violent[10] blossomed into a force of nature this year, and he was sorely missed down the stretch in the Sugar Bowl. Jonathan Allen flashed his five-star talent this year as he ascended to starting defensive end, and picked up another sack in the Sugar Bowl to finish second on the team with 4.5.
10 | Shamelessly pilfered from KongAtTheGates.
Senior Nick Perry made good down the stretch after being the subject of much ridicule around these parts to start the year, finishing with 4.5 defensed passes and a couple of picks. Jarran Reed was doing his best J.J. Watt impersonation to start the year, but quit tipping so many passes in favor of tackling everything in sight; his return in 2015 is huge, huge news. His fellow JUCO transfer D.J. Pettway picked up another sack in the Sugar Bowl, and has become quite the redemption story given his previous dismissal from the team[11].
11 | I hope you are reading, Mr. Taylor.
And that’s all, folks.
The 2014 Tide fielded an extraordinarily good defense with one or two critical flaws, and despite that almost carried a somewhat-mercurial offense all the way to a national title. Although several key cogs are departing in the form of Collins, DePriest, Dickson, and Perry, reinforcements are coming to join the ones already on campus, and the expectation should be yet another elite defense on the field in 2015.