:format(webp)/cdn.vox-cdn.com/uploads/chorus_image/image/45543498/usa-today-8336218.0.jpg)
BPI information courtesy of ESPN.com.
RPI information courtesy of CBS Sports.
All other statistics are courtesy of KenPom.com, Ken Pomeroy’s outstanding basketball analytics site.
But first, let’s talk about this whole "rating the conferences" thing...
Last week when I introduced this series, the main topic of conversation was my methodology for rating the conferences, which didn’t fly over too well with yall. As a refresher, I elected to make a combined rating based on an even combination of median PYTH and median BPI ratings. The median part is what tripped everybody up in particular, so let’s talk about that.
When you sit down to determine the strongest conference in all the land, you pick the SEC the first thing you have to do is decide is what does "strongest" mean? Does it mean the conference with the single best team? Does it mean the conference with the most number of teams above a certain benchmark? Does it mean the conference with the least number of teams under a different benchmark?
In my opinion, it’s none of those things, although the middle one (most number of "good" teams) comes closest to being legitimate, which is why you see it in the conference rating charts. To me, the strongest conference is going to be the one that has the strongest teams from top to bottom, such that the overall quality of the conference is high. So how do you measure that?
Well, there are a couple of different ways. One might take the midrange, where you find the mean of the minimum and maximum data points in a set (i.e., the best and worst teams of a conference), and use that as your rating. Unfortunately this is highly susceptible to outliers[1] and doesn’t really tell you much about the middle of a conference. Another option might be the plain old average rating, which is what a lot of folks were asking for last week. Once again, averages are highly susceptible to outliers, and would overrate a conference with one strong team[2]. I ended up going with the median, which is the measure of central tendency most resistant to the influence of outliers. It’s not going to ding a conference too hard for having one truly awful team[3], and it’s not going to overrate it for having a truly great team either.
1 | A great example is the WCC, where Gonzaga is elite but the only decent team there.
2 | The WCC is magically the #8 conference when you use average as the basis.
3 | Hi, Mississippi State!
So what about all of those special cases you mentioned last week? Well, they are just that — special cases. Not trying to call anybody out here, but one way of "breaking" the median approach that was mentioned would be to take a 15 team conference, hypothetically have the 7 best teams in that conference rate out in the top-10 of a metric, and the remaining 8 in say the 50s, such that the median rating would be in the 50s. Obviously, the conference strength there should be much higher than the 50s — that’s probably your strongest conference, and if you use the median approach you aren’t going to reach that conclusion. However, the likelihood of getting a distribution like this is remarkably low — you’d have to combine the Big 12 and the Southland or something to get it. Even if you did, the mean approach — while rating it higher — still wouldn't do it much justice, as the rating based on average rank would be somewhere in the 30s.
In reality, there’s no one right way to do this. Every method is going to have a test case that will cause that system to improperly rate a team or conference, it’s just the nature of the beast when you’re trying to do something like this. Every conference is going to have a different distribution of teams that is skewed in one direction or the other, and I went with the median approach to try to safeguard against that a bit.
Speaking of distributions, now would be a great time to introduce my feeble attempt at following krnxprs’ suggestion of a visual representation based on in-conference rank and combined rating, which is found below (you may find clicking to embiggen helpful):
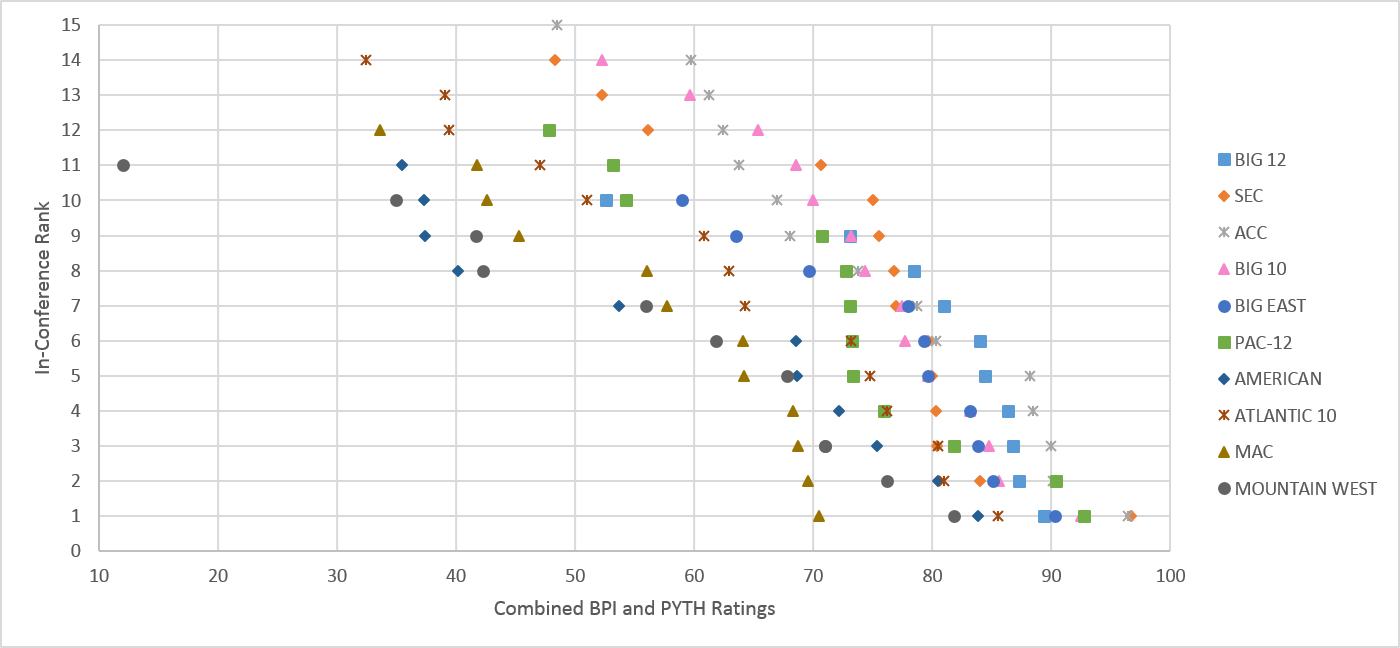
Now this was just a first attempt at this — I have some ideas on how to improve this graphic, but this will suffice for now. The axis titles should be clear, but just to clarify the best team in each conference will be at the bottom of the chart, and the strongest teams will be at the right-hand side of the chart, and vice-versa. So what can we draw from this graphic? I’m not the best at pattern recognition from a chart like this — there’s a reason I prefer tables of numbers — but this is what I see:
- The Big 12 is clearly the top conference. They don’t have the best team, but all of their teams are quite good and very closely packed at the top.
- The Big East is clearly the #2 conference; they have the same deal going on as the Big 12, but are just a step behind and have a couple of extra crappy teams thrown in.
- The SEC, ACC, and Big 10 are all kinda interwoven with one another, and very close overall. The ACC has the best teams, but also the worst bottom of the conference. The SEC and Big 10 have very similar distributions, with the SEC having a slight advantage.
- There’s a pretty steep dropoff after those five conferences and the other major, the PAC-12.
- The Big 10 looks just so darn kyooot with those little pink triangles.
The median rating approach you’ll see in a bit reflects all of the conclusions I just drew[4], but I may be kinda biased since it’s what I want to do. Thoughts on this? As always, I’m open to discourse on how to make this stuff better — let me know in the comments.
4 | Not the bit about the pink triangles, that’s just me openly mocking the Midwest and their accent(s). Ironic, I know.
The SEC Rundown
| The SEC Through January 25th | |||||||
|---|---|---|---|---|---|---|---|
| Rank | Team | Record | PYTH | BPI | RPI | OE+ | DE+ |
| 1 | KENTUCKY | 19-0 | 0.9835 (2) | 95 (1) | 0.7058 (2) | 115.4 (12) | 80.8 (1) |
| 2 | GEORGIA | 13-5 | 0.8624 (29) | 81.8 (21) | 0.6144 (24) | 108.1 (56) | 92.1 (28) |
| 3 | OLE MISS | 12-7 | 0.8397 (34) | 76 (42) | 0.5858 (48) | 113.4 (21) | 98.2 (114) |
| 4 | LSU | 15-4 | 0.8378 (35) | 77 (37) | 0.5965 (37) | 105.2 (94) | 91.2 (18) |
| 5 | FLORIDA | 10-9 | 0.8349 (37) | 77.2 (35) | 0.5529 (85) | 106.9 (70) | 92.9 (39) |
| 6 | ARKANSAS | 15-4 | 0.8158 (44) | 77.7 (33) | 0.6157 (21) | 115 (15) | 101 (169) |
| 7 | ALABAMA | 13-6 | 0.8154 (45) | 72.4 (59) | 0.5855 (49) | 107.1 (68) | 94.1 (45) |
| 8 | SOUTH CAROLINA | 10-8 | 0.7923 (51) | 71.8 (63) | 0.5307 (118) | 102.3 (153) | 91 (16) |
| 9 | TEXAS A&M | 13-5 | 0.7828 (56) | 75.3 (47) | 0.6018 (33) | 105.8 (87) | 94.6 (54) |
| 10 | VANDERBILT | 11-8 | 0.7649 (66) | 73.6 (53) | 0.5352 (114) | 109.7 (41) | 99 (127) |
| 11 | OPPONENT | 12-6 | 0.7124 (85) | 70 (67) | 0.5797 (56) | 105.9 (85) | 97.8 (106) |
| 12 | ALABAMA POLY | 10-9 | 0.5491 (143) | 57.3 (136) | 0.514 (141) | 99.7 (205) | 98 (109) |
| 13 | MISSOURI | 7-12 | 0.504 (161) | 54.1 (156) | 0.5054 (162) | 101.2 (172) | 101.1 (170) |
| 14 | MISSISSIPPI STATE | 9-10 | 0.4224 (201) | 54.4 (154) | 0.4751 (208) | 97.4 (253) | 100.1 (145) |
Wondering what all these terms are?
- RPI: The Ratings Percentage Index, a measure of team strength based on winning percentage, the winning percentage of a team’s opponents, and the winning percentage of those opponents’ opponents. For a more detailed
excoriationdiscussion of RPI, check out this section of the PTN Basketball Primer. - BPI: The Basketball Power Index is an opponent-adjusted statistic created by ESPN that accounts for scoring margin, pace, game location, and absence of critical players. It can be used both predictively and as a measure of a team’s strength to that point in the season.
- PYTH: The Pythagorean Rating, a measure of a team’s expected winning percentage against an average D-I team, which is based on the concept of Pythagorean Expectation. For a more detailed discussion of PYTH ratings, check out this section of the PTN Basketball Primer.
- Luck: A measure of how a team’s actual performance has outstripped that of its expected performance based on PYTH rating.
- OE+: Adjusted Offensive Efficiency, a measure of a team’s offensive performance on a possession-by-possession basis, adjusted to provide the expected performance against an average D-I team. Expressed in points scored per 100 possessions.
- DE+: Adjusted Defensive Efficiency, a measure of a team’s defensive performance on a possession-by-possession basis, adjusted to provide the expected performance against an average D-I team. Expressed in points allowed per 100 possessions.
- T+: Adjusted Tempo, a measure of a team’s expected pace against a team that wants to play at an average D-I pace. Expressed as possessions per game.
- Sched. PYTH: The Schedule PYTH Rating, a PYTH rating based on the adjusted offensive and defensive efficiencies of a team’s opponents, used as a strength-of-schedule rating.
- NCS PYTH: The Non-Conference Schedule PYTH Rating, simply the schedule PYTH calculated for non-conference opponents only.
- Opp. OE+: Opponents’ Adjusted Offensive Efficiency, the average adjusted offensive efficiency of a team’s opponents.
- Opp. DE+: Opponents’ Adjusted Defensive Efficiency, the average adjusted defensive efficiency of a team’s opponents
Wondering what all of this means? Check out the PTN Basketball primer!
Kentucky is still far and away the class of the SEC, but some of the shine wore off since last week. They are no longer the consensus #1 team, as RPI now favors Kansas[5] and PYTH has tagged Virginia. That’s what happens when you play footsie with the likes of Vanderbilt instead of destroying them Alderaan-style. That sort of behavior is the best chance to see the Wildcats take a loss this season — eventually they will mess around and lose to a good team they underestimated. Can’t see any possibilities of that on the immediate horizon… except for maybe that rematch with the Tide on the 31st.
5 | RPI is dumb.
There’s a bit of a shakeup at the top, as Georgia’s big road win over Ole Miss and Florida’s tight loss to the same — their third in a row — caused the Gators to free-fall down to fifth. Arkansas’s next based on the strength of that #15 offense, and we all saw what it can do last Thursday in Fayetteville. Alabama is holding steady at 7th, after a tough road loss to Arkansas and a comeback win at home over little brother that left conference irritant Cinmeon Bowers[6] mercifully speechless. South Carolina kicks off the bottom half of the league, with a still-dangerous defense lurking for opponents traveling to Columbia[7]. Texas A&M and Vandy bring up the rear among solid teams in the conference.
6 | So glad we have a spiritual successor to Marshall Henderson. So glad.
7 | Foreshadowing!
The API Mafia outbid the REC for the services of the SEC’s referees last Saturday, but it turned out to not be enough and they now hover above 0.500 on the year. They’re keeping Missouri and CLANGA company at the bottom of the conference, just behind that one school that used to employ their coach before he broke a bunch of rules. For Aaron Craft of all people! Totally shoulda hired him and fired Grant last season.
The National Rundown
| Conference Rankings Through January 25th | |||||
|---|---|---|---|---|---|
| Rank | Conference | Rating | Top-50 Teams | Med. PYTH | Med. BPI |
| 1 | BIG 12 | 84.2 | 8 | 0.8781 (1) | 80.6 (1) |
| 2 | BIG EAST | 79.6 | 7 | 0.8253 (2) | 76.7 (2) |
| 3 | SEC | 77.4 | 7 | 0.8039 (3) | 74.5 (3) |
| 4 | BIG TEN | 75.5 | 6 | 0.7768 (4) | 73.4 (4) |
| 5 | ACC | 73.8 | 7 | 0.7452 (6) | 73.0 (5) |
| 6 | PAC-12 | 73.1 | 3 | 0.7564 (5) | 70.5 (6) |
| 7 | AMERICAN | 68.4 | 2 | 0.7191 (7) | 64.9 (7) |
| 8 | ATLANTIC 10 | 63.6 | 3 | 0.6483 (8) | 62.4 (8) |
| 9 | MOUNTAIN WEST | 61.9 | 1 | 0.6213 (9) | 61.6 (9) |
| 10 | MAC | 60.8 | 0 | 0.6145 (10) | 60.2 (10) |
We more or less covered most of this already, so I’m not going to spend much time here. I’m going to continue to play around with a graphic to represent this, but for now the median approach is sticking around. I may calculate it based on average ranking as well and give you both to chew on, or take some sort of combination of both — haven’t decided yet. Just know the Big 12 is in a class of its own so far this year, the other major conferences form the next tier, and then you have a bit of a drop-off to the mid-majors.
The Non-Alabama Games of the Week
Outside of two blockbuster Alabama games the SEC schedule for the next week is a bit of a disappointment. I only picked two games to preview this week, and calling this first one a game of the week is a bit of a stretch as it is.
Arkansas Razorbacks @ Florida Gators, Saturday January 31st
12 PM CST / 1 PM EST, CBS
| Overall Quality | |||||
|---|---|---|---|---|---|
| FLORIDA | ARKANSAS | THE EDGE | |||
| BPI | 77.2 (35) | BPI | 77.7 (33) | PUSH | |
| PYTH | 0.8349 (37) | PYTH | 0.8158 (44) | FLORIDA | |
| OE+ | 106.9 (70) | DE+ | 101 (169) | FLORIDA | |
| DE+ | 92.9 (39) | OE+ | 115 (15) | ARKANSAS | |
| T+ | 62.7 (299) | T+ | 70.1 (16) | ARKANSAS | |
This is a tough one. On the one hand, Florida’s riding a three-game losing streak, may be riding a four-gamer by the time this rolls around, and are likely at the point where an SEC title will be required for an NCAA berth. Arkansas, on the other hand, features two of the SEC’s top scorers in Bobby Portis and the electric Michael Qualls, and will likely be riding a three-gamer win streak before this game takes place. The Razorbacks may find it tough sledding against a decent UF defense playing at home, and like every game they will have to outscore their opponent to win. There’s such a tempo disparity between these two squads that I think it’s relevant, and I’m overruling the magic box in favor of the Razorbacks.
THE PICK: Arkansas Razorbacks
Georgia Bulldogs @ South Carolina Gamecocks, Saturday January 31st
3 PM CST / 4 PM EST, ESPNU / WatchESPN.com
| Overall Quality | |||||
|---|---|---|---|---|---|
| SOUTH CAROLINA | GEORGIA | THE EDGE | |||
| BPI | 71.8 (63) | BPI | 81.8 (21) | GEORGIA | |
| PYTH | 0.7923 (51) | PYTH | 0.8624 (29) | GEORGIA | |
| OE+ | 102.3 (153) | DE+ | 92.1 (28) | GEORGIA | |
| DE+ | 91 (16) | OE+ | 108.1 (56) | SOUTH CAROLINA | |
| T+ | 67.1 (80) | T+ | 66.4 (117) | SOUTH CAROLINA | |
At first this appears to be a mismatch, until you remember this is South Carolina playing at home. The home-court advantage hasn’t always been there this season for the Gamecocks, but with the exception of Kentucky they’ve played each SEC opponent tough this year. At the end I think Georgia’s just too strong, but don’t be shocked if South Carolina walks away with this one, as the magic box has this one at 54% for the Gamecocks.
THE PICK: Georgia Bulldogs